Edit chart
Loading graph
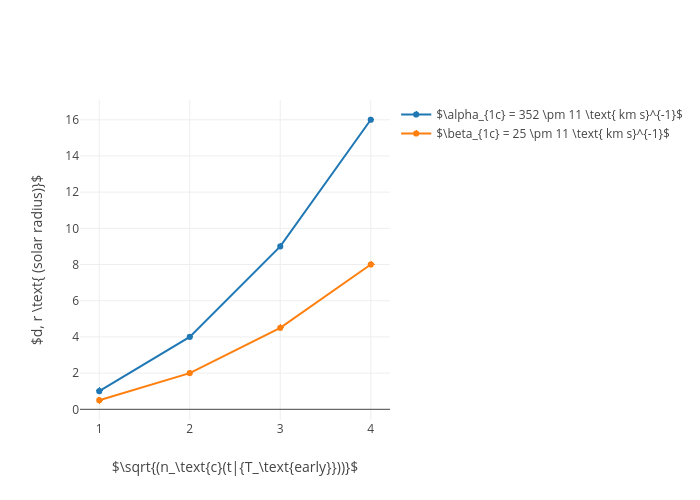
Pythonplotbot's interactive graph and data of "$d, r \text{ (solar radius)}$ vs $\sqrt{(n_\text{c}(t|{T_\text{early}}))}$" is a scatter chart, showing $\alpha_{1c} = 352 \pm 11 \text{ km s}^{-1}$ vs $\beta_{1c} = 25 \pm 11 \text{ km s}^{-1}$; with $\sqrt{(n_\text{c}(t|{T_\text{early}}))}$ in the x-axis and $d, r \text{ (solar radius)}$ in the y-axis.. The x-axis shows values from 0 to 0. The y-axis shows values from 0 to 0.