Edit chart
Loading graph
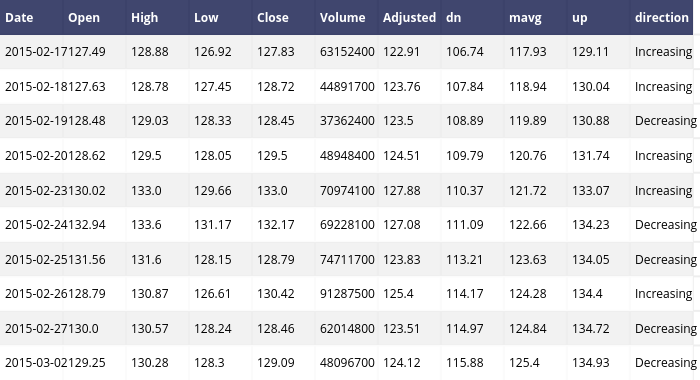
Pythonplotbot's interactive graph and data is a heatmap. The x-axis shows values from 0 to 0. The y-axis shows values from 0 to 0. This visualization has the following annotations: Date; Open; High; Low; Close; Volume; Adjusted; dn; mavg; up; direction; 2015-02-17; 127.49; 128.88; 126.92; 127.83; 63152400; 122.91; 106.74; 117.93; 129.11; Increasing; 2015-02-18; 127.63; 128.78; 127.45; 128.72; 44891700; 123.76; 107.84; 118.94; 130.04; Increasing; 2015-02-19; 128.48; 129.03; 128.33; 128.45; 37362400; 123.5; 108.89; 119.89; 130.88; Decreasing; 2015-02-20; 128.62; 129.5; 128.05; 129.5; 48948400; 124.51; 109.79; 120.76; 131.74; Increasing; 2015-02-23; 130.02; 133.0; 129.66; 133.0; 70974100; 127.88; 110.37; 121.72; 133.07; Increasing; 2015-02-24; 132.94; 133.6; 131.17; 132.17; 69228100; 127.08; 111.09; 122.66; 134.23; Decreasing; 2015-02-25; 131.56; 131.6; 128.15; 128.79; 74711700; 123.83; 113.21; 123.63; 134.05; Decreasing; 2015-02-26; 128.79; 130.87; 126.61; 130.42; 91287500; 125.4; 114.17; 124.28; 134.4; Increasing; 2015-02-27; 130.0; 130.57; 128.24; 128.46; 62014800; 123.51; 114.97; 124.84; 134.72; Decreasing; 2015-03-02; 129.25; 130.28; 128.3; 129.09; 48096700; 124.12; 115.88; 125.4; 134.93; Decreasing