Edit chart
Loading graph
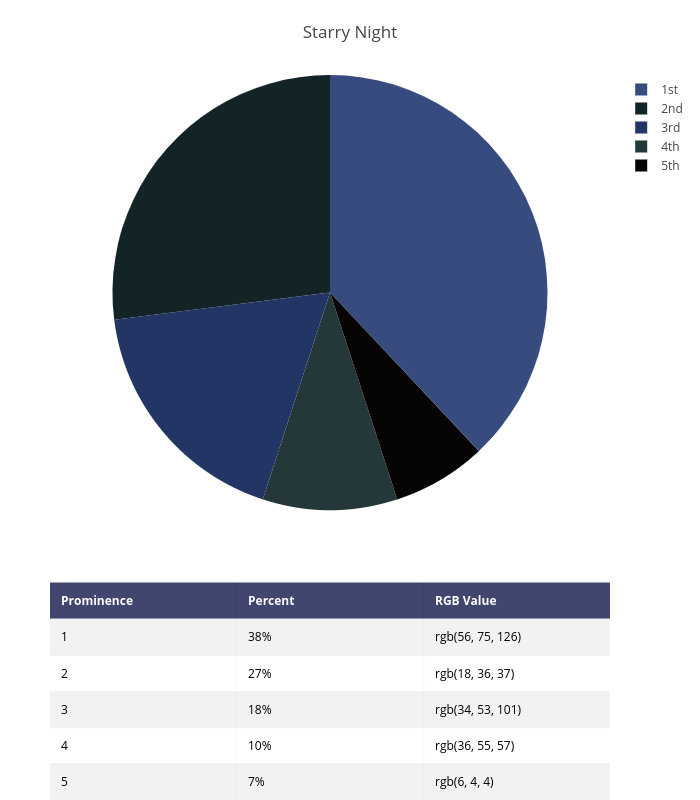
Pythonplotbot's interactive graph and data of "Starry Night" is a heatmap, showing Starry Night. The x-axis shows values from 0 to 0. The y-axis shows values from 0 to 0. This visualization has the following annotations: Prominence; Percent; RGB Value; 1; 38%; rgb(56, 75, 126); 2; 27%; rgb(18, 36, 37); 3; 18%; rgb(34, 53, 101); 4; 10%; rgb(36, 55, 57); 5; 7%; rgb(6, 4, 4)