Edit chart
Loading graph
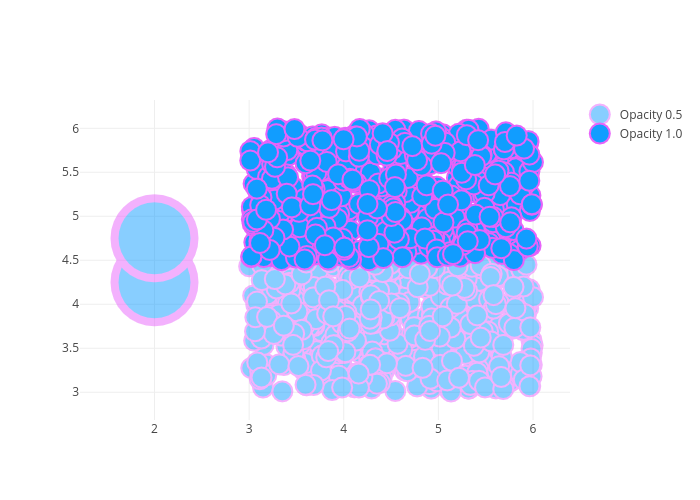
Pythonplotbot's interactive graph and data of "Opacity 0.5 vs Opacity 1.0" is a scatter chart, showing Opacity 0.5 vs Opacity 1.0. The x-axis shows values from 0 to 0. The y-axis shows values from 0 to 0.