Edit chart
Loading graph
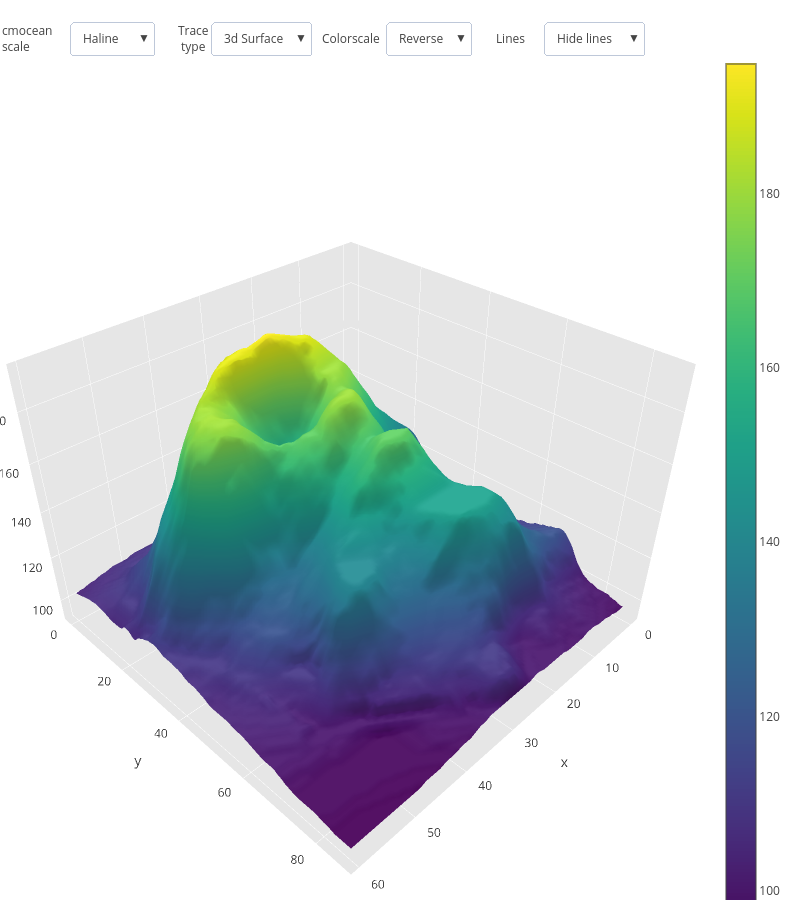
Pythonplotbot's interactive graph and data is a surface. The x-axis shows values from 0 to 0. The y-axis shows values from 0 to 0. This visualization has the following annotations: cmoceanscale; Tracetype; Colorscale; Lines