Edit chart
Loading graph
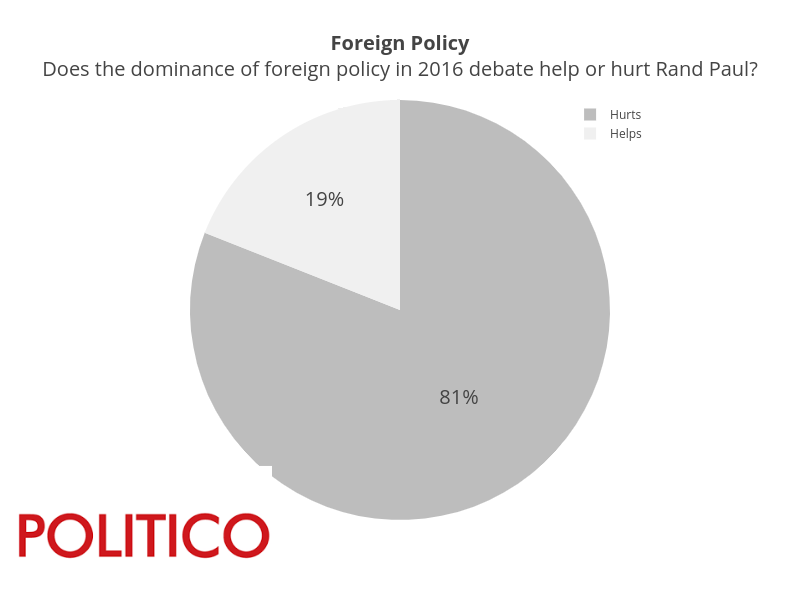
Pythonplotbot's interactive graph and data of "Foreign PolicyDoes the dominance of foreign policy in 2016 debate help or hurt Rand Paul?" is a pie, showing Col2. The x-axis shows values from 0 to 0. The y-axis shows values from 0 to 0.