Edit chart
Loading graph
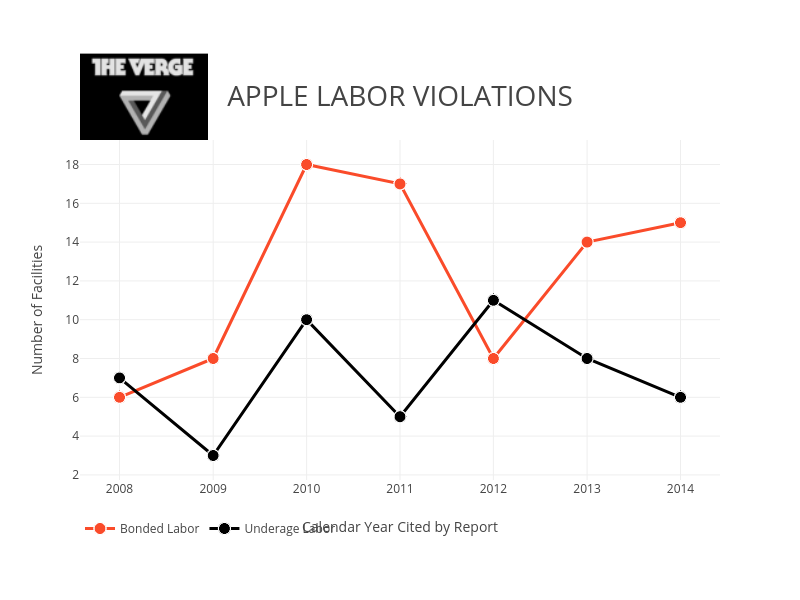
Pythonplotbot's interactive graph and data of "APPLE LABOR VIOLATIONS" is a scatter chart, showing Bonded Labor vs Underage Labor; with Calendar Year Cited by Report in the x-axis and Number of Facilities in the y-axis.. The x-axis shows values from 1185319738699.6904 to 1402266661300.3096. The y-axis shows values from 1.7371134020618557 to 19.262886597938145.