Edit chart
Loading graph
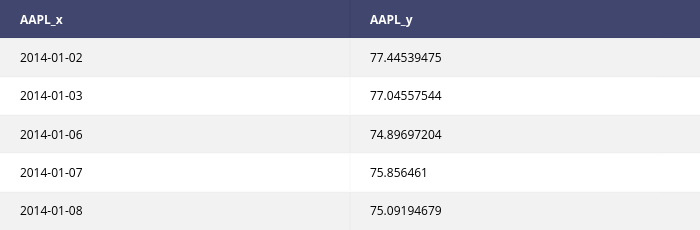
Pythonplotbot's interactive graph and data is a heatmap. The x-axis shows values from 0 to 0. The y-axis shows values from 0 to 0. This visualization has the following annotations: AAPL_x; AAPL_y; 2014-01-02; 77.44539475; 2014-01-03; 77.04557544; 2014-01-06; 74.89697204; 2014-01-07; 75.856461; 2014-01-08; 75.09194679