Edit chart
Loading graph
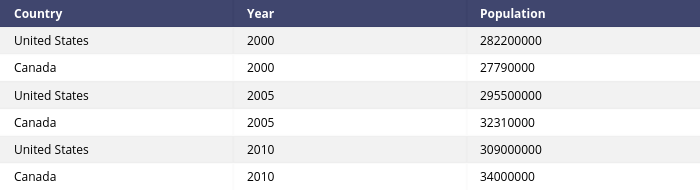
Pythonplotbot's interactive graph and data is a heatmap. The x-axis shows values from 0 to 0. The y-axis shows values from 0 to 0. This visualization has the following annotations: Country; Year; Population; United States; 2000; 282200000; Canada; 2000; 27790000; United States; 2005; 295500000; Canada; 2005; 32310000; United States; 2010; 309000000; Canada; 2010; 34000000