Edit chart
Loading graph
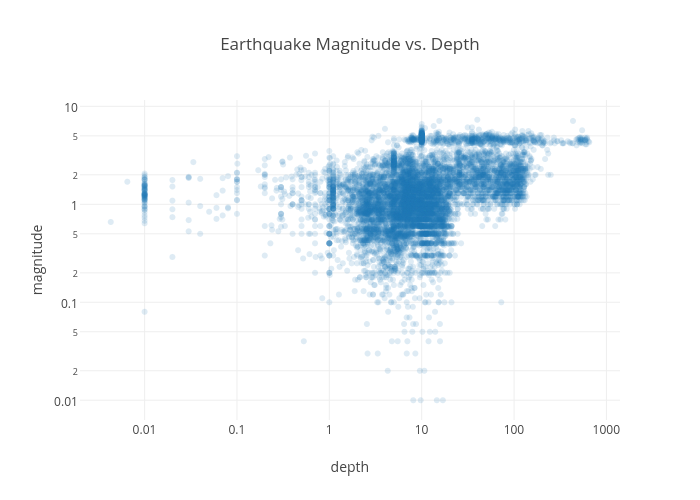
Python-demo-account's interactive graph and data of "Earthquake Magnitude vs. Depth" is a scatter chart; with depth in the x-axis and magnitude in the y-axis.. The x-axis shows values from 0 to 0. The y-axis shows values from 0 to 0.