Edit chart
Loading graph
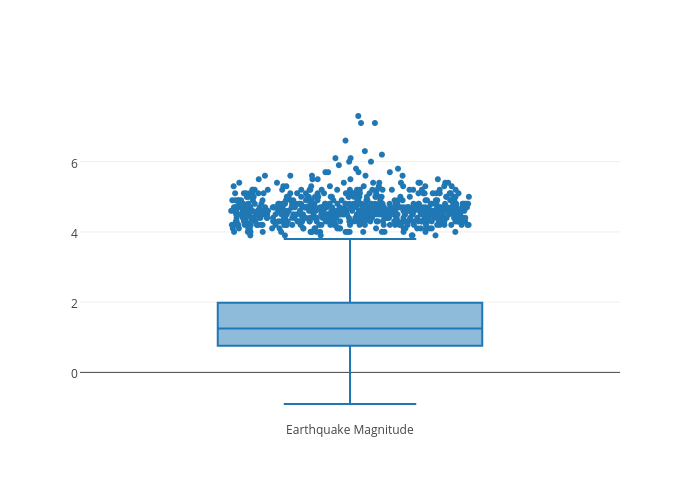
Python-demo-account's interactive graph and data of "Earthquake Magnitude" is a box plot, showing Earthquake Magnitude. The x-axis shows values from 0 to 0. The y-axis shows values from 0 to 0.