Edit chart
Loading graph
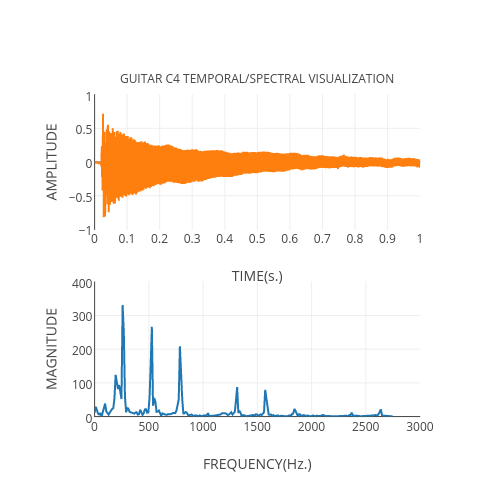
Plotbot's interactive graph and data of "AMPLITUDE vs TIME(s.)" is a line chart; with TIME(s.) in the x-axis and AMPLITUDE in the y-axis.. The x-axis shows values from 0.0 to 1.0. The y-axis shows values from -1.0 to 1.0. This visualization has the following annotation: GUITAR C4 TEMPORAL/SPECTRAL VISUALIZATION