Edit chart
Loading graph
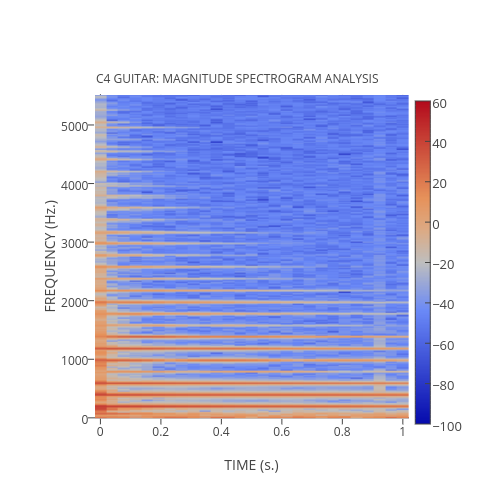
Plotbot's interactive graph and data of "FREQUENCY (Hz.) vs TIME (s.)" is a heatmap; with TIME (s.) in the x-axis and FREQUENCY (Hz.) in the y-axis.. The x-axis shows values from -0.019231 to 1.019231. The y-axis shows values from -5.393836 to 5517.893836. This visualization has the following annotation: C4 GUITAR: MAGNITUDE SPECTROGRAM ANALYSIS