Edit chart
Loading graph
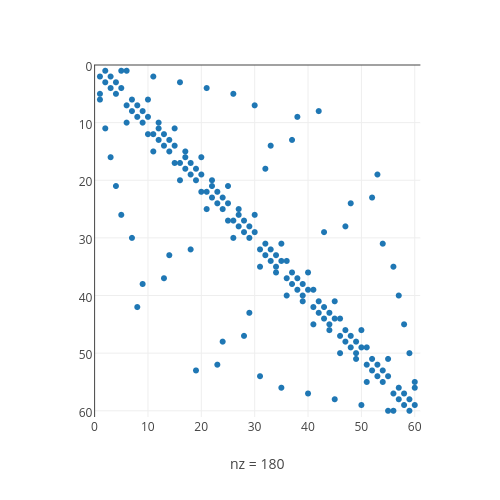
Plotbot's interactive graph and data is a scatter chart; with nz = 180 in the x-axis. The x-axis shows values from 0.0 to 61.0. The y-axis shows values from 61.0 to 0.0.