Edit chart
Loading graph
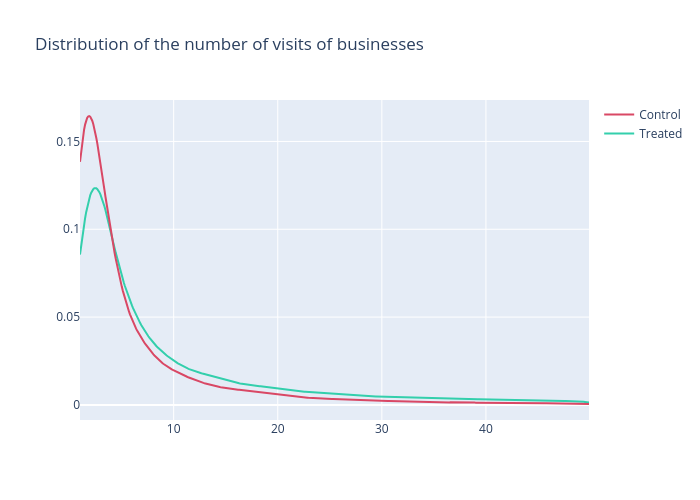
Pm_epfl's interactive graph and data of "Distribution of the number of visits of businesses" is a line chart, showing Treated vs Control. The x-axis shows values from 1 to 49.902. The y-axis shows values from -0.008605849895730558 to 0.17361038435399317.