Edit chart
Loading graph
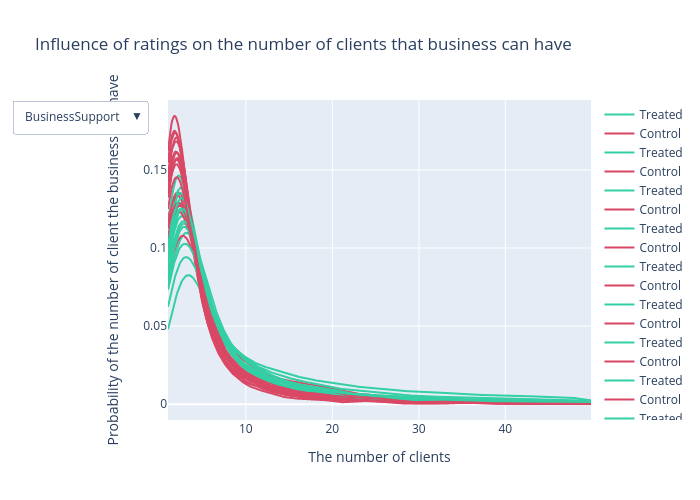
Pm_epfl's interactive graph and data of "Influence of ratings on the number of clients that business can have" is a scatter chart, showing Treated, Control, Treated, Control, Treated, Control, Treated, Control, Treated, Control, Treated, Control, Treated, Control, Treated, Control, Treated, Control, Treated, Control, Treated, Control, Treated, Control, Treated, Control, Treated, Control, Treated, Control, Treated, Control, Treated, Control; with The number of clients in the x-axis and Probability of the number of client the business can have in the y-axis.. The x-axis shows values from 0 to 0. The y-axis shows values from 0 to 0.