Edit chart
Loading graph
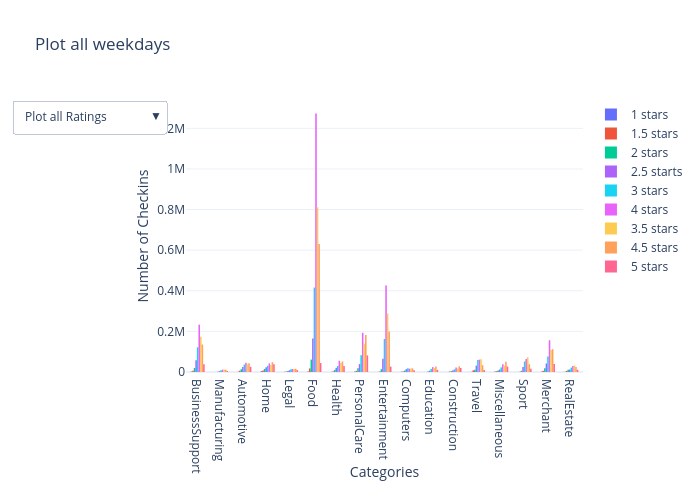
Pm_epfl's interactive graph and data of "Plot all weekdays" is a bar chart, showing 1 stars, 1.5 stars, 2 stars, 2.5 starts, 3 stars, 4 stars, 3.5 stars, 4.5 stars, 5 stars; with Categories in the x-axis and Number of Checkins in the y-axis.. The x-axis shows values from -0.5 to 16.5. The y-axis shows values from 0 to 1339551.5789473685.