Edit chart
Loading graph
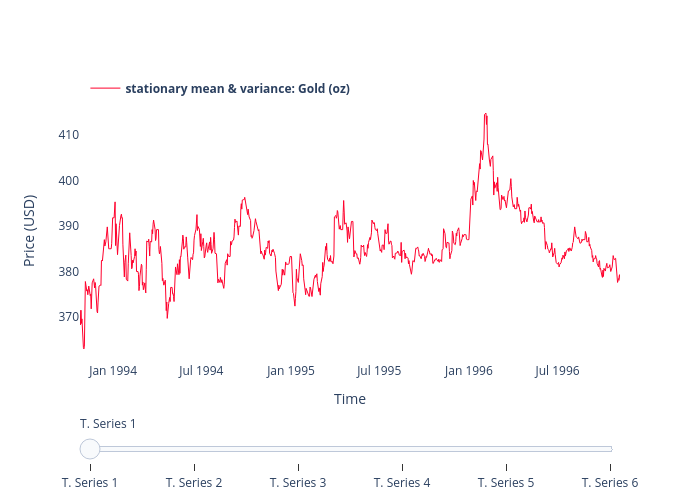
Pmdias83's interactive graph and data of "Price (USD) vs Time" is a line chart, showing stationary mean & variance: Gold (oz); with Time in the x-axis and Price (USD) in the y-axis.. The x-axis shows values from 1993-10-25 to 1996-11-06. The y-axis shows values from 360.1222222222222 to 417.6777777777778.