Edit chart
Loading graph
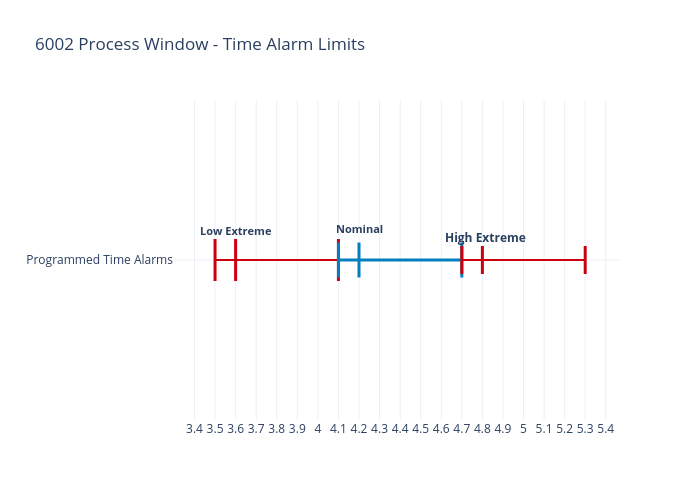
Osypkamedtec's interactive graph and data of "6002 Process Window - Time Alarm Limits" is a , showing Low Extreme Window, Nominal Window, High Extreme Window. The x-axis shows values from 3.364717983064632 to 5.424518011768646. The y-axis shows values from -1 to 1. This visualization has the following annotations: Nominal; Low Extreme; High Extreme