Edit chart
Loading graph
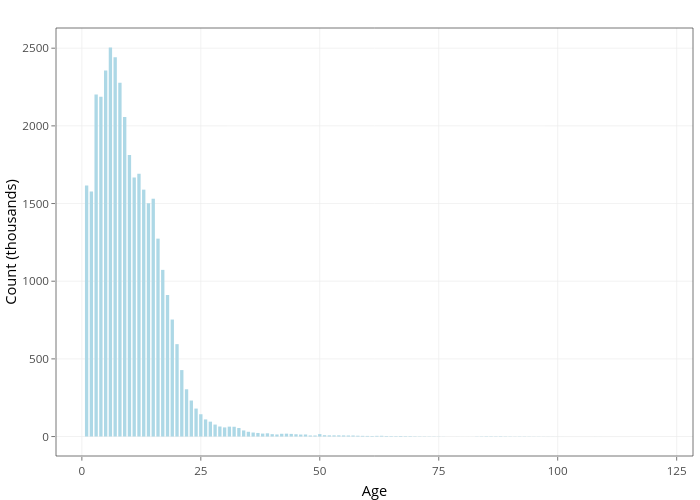
Oliverly's interactive graph and data of "Count (thousands) vs Age" is a bar chart; with Age in the x-axis and Count (thousands) in the y-axis.. The x-axis shows values from -5.435 to 128.435. The y-axis shows values from -125.24 to 2630.04.