Edit chart
Loading graph
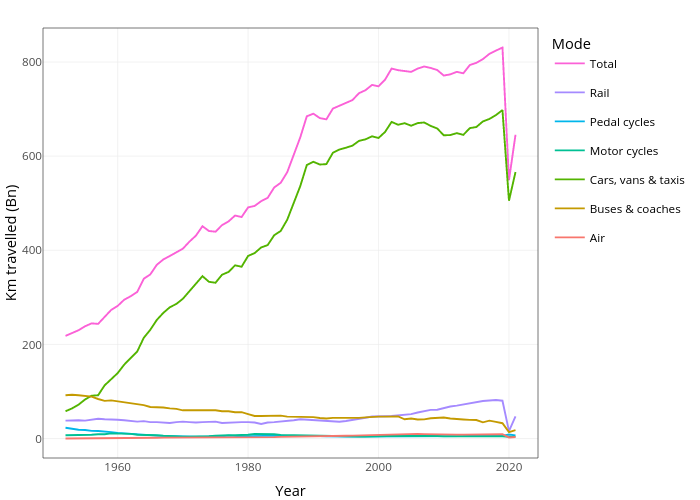
Oliverly's interactive graph and data of "Km travelled (Bn) vs Year" is a line chart, showing Total, Rail, Pedal cycles, Motor cycles, Cars, vans & taxis, Buses & coaches, Air; with Year in the x-axis and Km travelled (Bn) in the y-axis.. The x-axis shows values from 1948.55 to 2024.45. The y-axis shows values from -41.325 to 872.225.