Edit chart
Loading graph
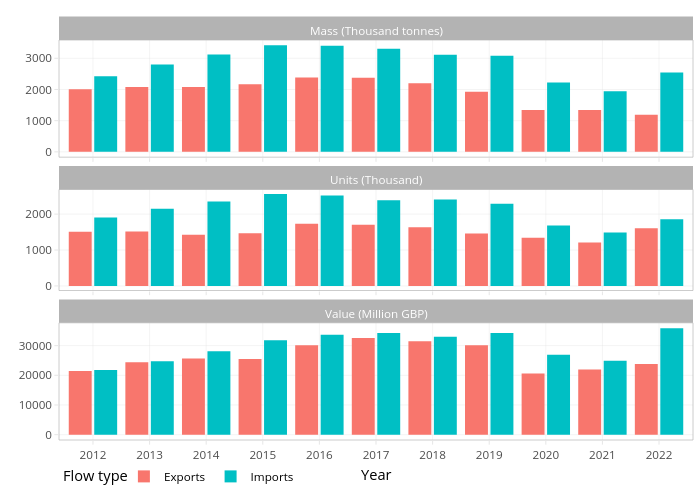
Oliverly's interactive graph and data of "Exports, Exports, Exports, Imports, Imports, Imports" is a , showing Exports, Exports, Exports, Imports, Imports, Imports. The x-axis shows values from 0.4 to 11.6. The y-axis shows values from -170.805 to 3586.905. This visualization has the following annotations: Year; Mass (Thousand tonnes); Units (Thousand); Value (Million GBP)