Edit chart
Loading graph
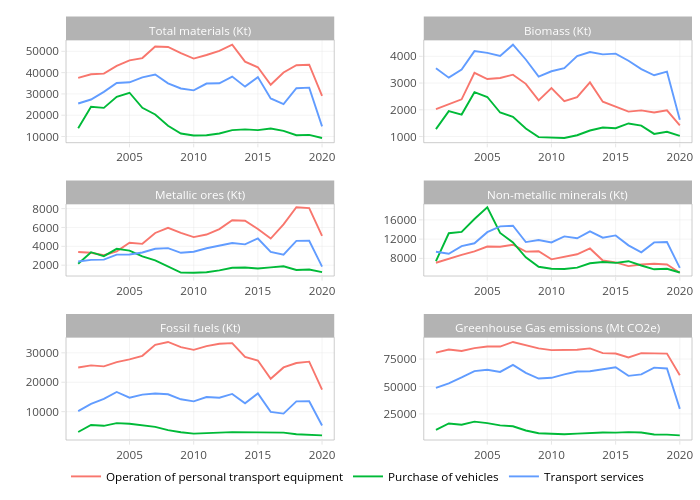
Oliverly's interactive graph and data of "Operation of personal transport equipment, Operation of personal transport equipment, Operation of personal transport equipment, Operation of personal transport equipment, Operation of personal transport equipment, Operation of personal transport equipment, Purchase of vehicles, Purchase of vehicles, Purchase of vehicles, Purchase of vehicles, Purchase of vehicles, Purchase of vehicles, Transport services, Transport services, Transport services, Transport services, Transport services, Transport services" is a line chart, showing Operation of personal transport equipment, Operation of personal transport equipment, Operation of personal transport equipment, Operation of personal transport equipment, Operation of personal transport equipment, Operation of personal transport equipment, Purchase of vehicles, Purchase of vehicles, Purchase of vehicles, Purchase of vehicles, Purchase of vehicles, Purchase of vehicles, Transport services, Transport services, Transport services, Transport services, Transport services, Transport services. The x-axis shows values from 2000.05 to 2020.95. The y-axis shows values from 7109.63 to 55319.77. This visualization has the following annotations: Total materials (Kt); Biomass (Kt); Metallic ores (Kt); Non-metallic minerals (Kt); Fossil fuels (Kt); Greenhouse Gas emissions (Mt CO2e)