Edit chart
Loading graph
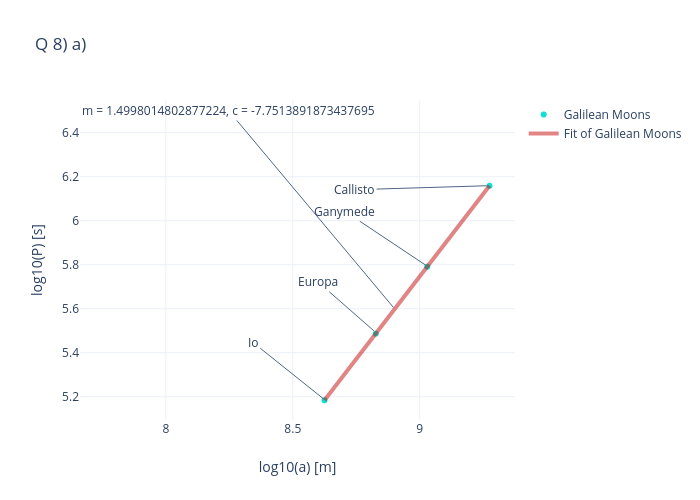
Nishil03's interactive graph and data of "Q 8) a)" is a scatter chart, showing Galilean Moons; with log10(a) [m] in the x-axis and log10(P) [s] in the y-axis.. The x-axis shows values from 8.56778844029308 to 9.314654457810553. The y-axis shows values from 5.120295826060299 to 6.222889805939701. This visualization has the following annotations: Io; Europa; Ganymede; Callisto; m = 1.4998014802877224, c = -7.7513891873437695