Edit chart
Loading graph
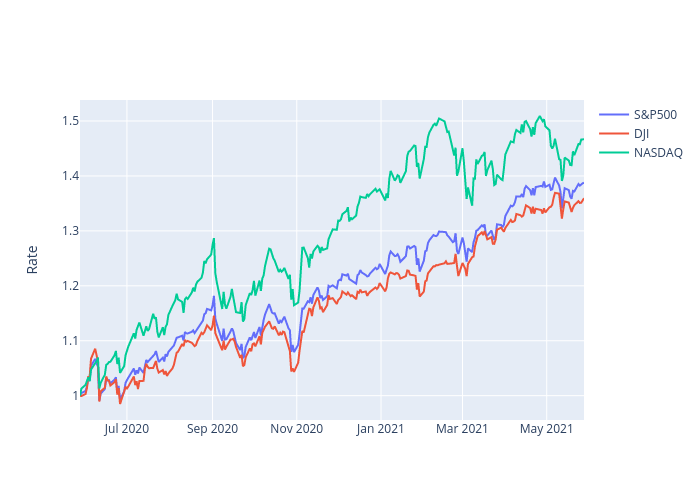
Naokiplotly's interactive graph and data of "S&P500, DJI, NASDAQ" is a scatter chart, showing S&P500, DJI, NASDAQ; with Rate in the y-axis. The x-axis shows values from 0 to 0. The y-axis shows values from 0 to 0.