Edit chart
Loading graph
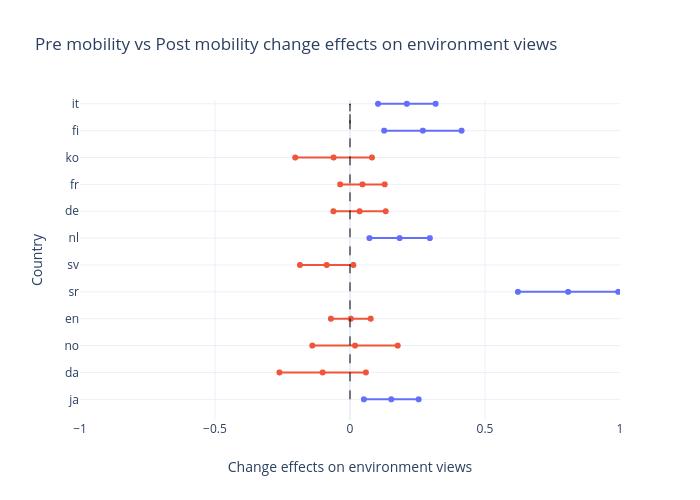
Mrzaiko's interactive graph and data of "Pre mobility vs Post mobility change effects on environment views" is a , showing ja, da, no, en, sr, sv, nl, de, fr, ko, fi, it, 0; with Change effects on environment views in the x-axis and Country in the y-axis.. The x-axis shows values from -1 to 1. The y-axis shows values from -0.7698195735374522 to 11.14053855120618.