Edit chart
Loading graph
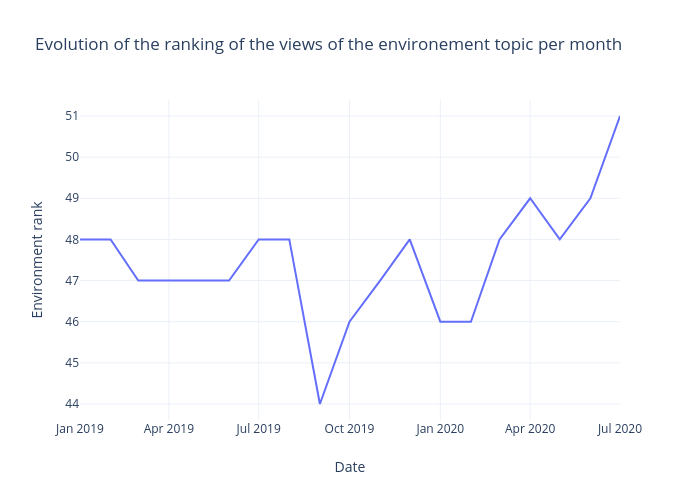
Mrzaiko's interactive graph and data of "Evolution of the ranking of the views of the environement topic per month" is a line chart; with Date in the x-axis and Environment rank in the y-axis.. The x-axis shows values from 2019-01-01 to 2020-07-01. The y-axis shows values from 43.611111111111114 to 51.388888888888886.