Edit chart
Loading graph
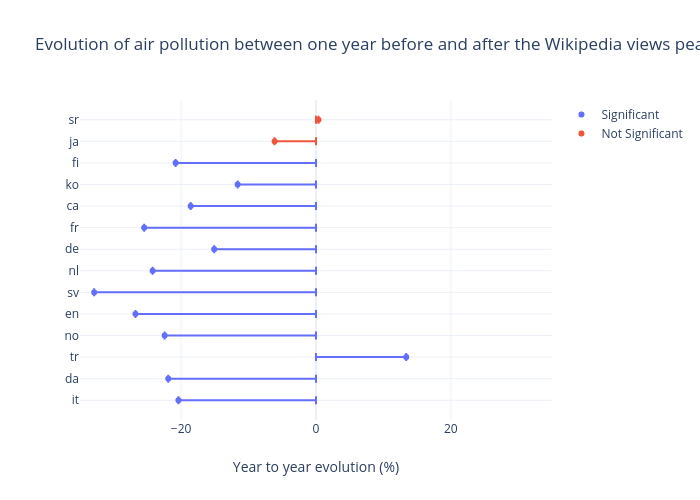
Mrzaiko's interactive graph and data of "Evolution of air pollution between one year before and after the Wikipedia views peak?" is a scatter chart, showing Significant vs Not Significant; with Year to year evolution (%) in the x-axis. The x-axis shows values from -35 to 35. The y-axis shows values from -0.8694942903752041 to 13.869494290375204.