Edit chart
Loading graph
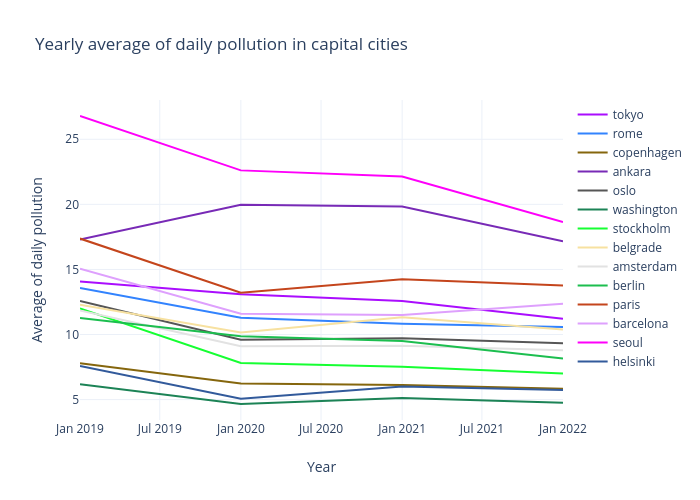
Mrzaiko's interactive graph and data of "Yearly average of daily pollution in capital cities" is a line chart, showing tokyo, rome, copenhagen, ankara, oslo, washington, stockholm, belgrade, amsterdam, berlin, paris, barcelona, seoul, helsinki; with Year in the x-axis and Average of daily pollution in the y-axis.. The x-axis shows values from 2019-01-01 to 2022-01-01. The y-axis shows values from 3.4340264848200404 to 28.015791870386373.