Edit chart
Loading graph
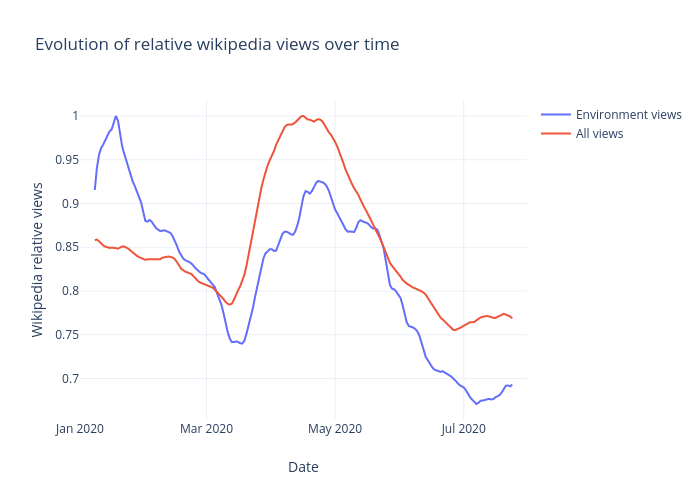
Mrzaiko's interactive graph and data of "Evolution of relative wikipedia views over time" is a line chart, showing Environment views vs All views; with Date in the x-axis and Wikipedia relative views in the y-axis.. The x-axis shows values from 2020-01-01 to 2020-07-31. The y-axis shows values from 0.6526061111111111 to 1.018283888888889.