Edit chart
Loading graph
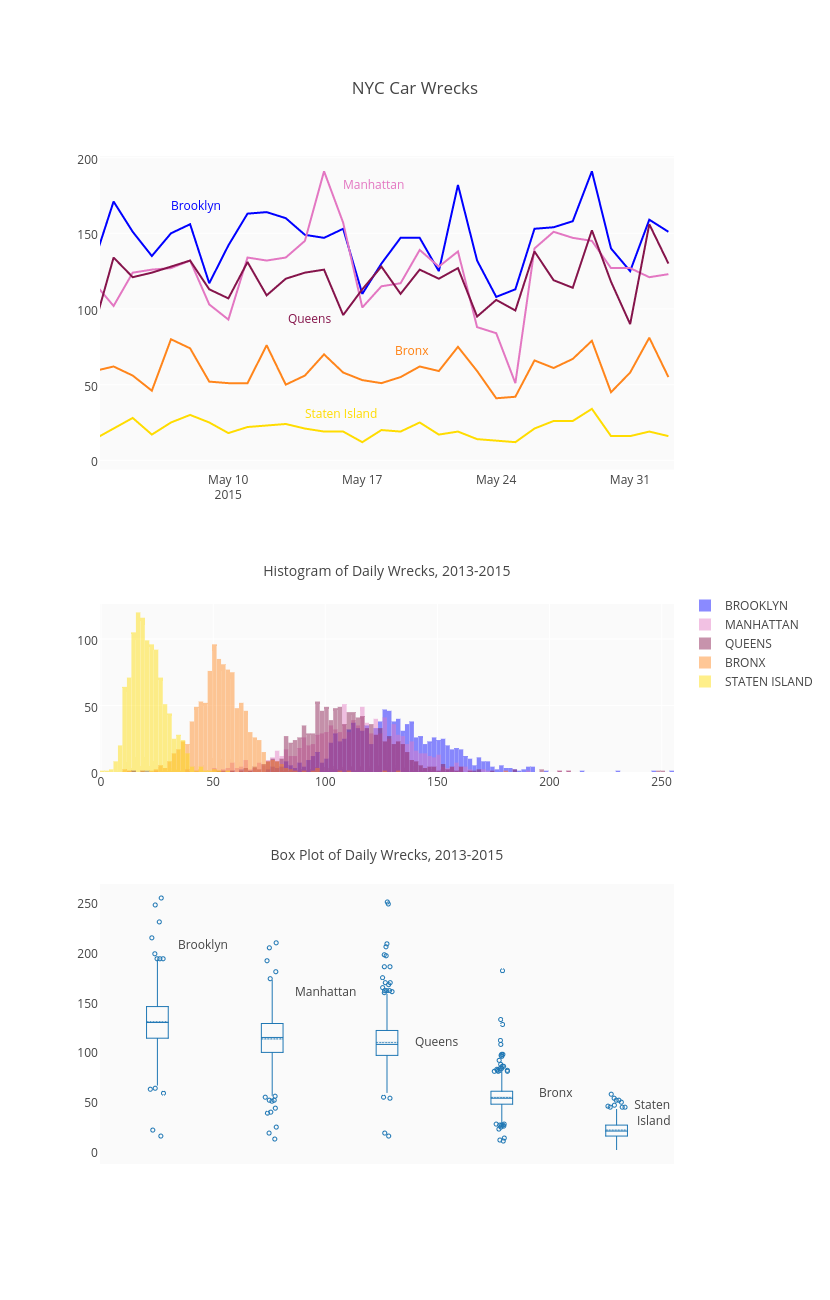
Mattsundquist's interactive graph and data of "NYC Car Wrecks" is a line chart, showing BROOKLYN, MANHATTAN, QUEENS, BRONX, STATEN ISLAND, BROOKLYN, MANHATTAN, QUEENS, BRONX, STATEN ISLAND, BROOKLYN, MANHATTAN, QUEENS, BRONX, STATEN ISLAND; with Histogram of Daily Wrecks, 2013-2015 in the x-axis. The x-axis shows values from 1430636272215.3381 to 1433228400000. The y-axis shows values from -6.132524206184797 to 201.0857259274796. This visualization has the following annotations: Manhattan; Brooklyn; Queens; Bronx; Brooklyn; Manhattan; Queens; Bronx; Staten Island; Staten Island