Edit chart
Loading graph
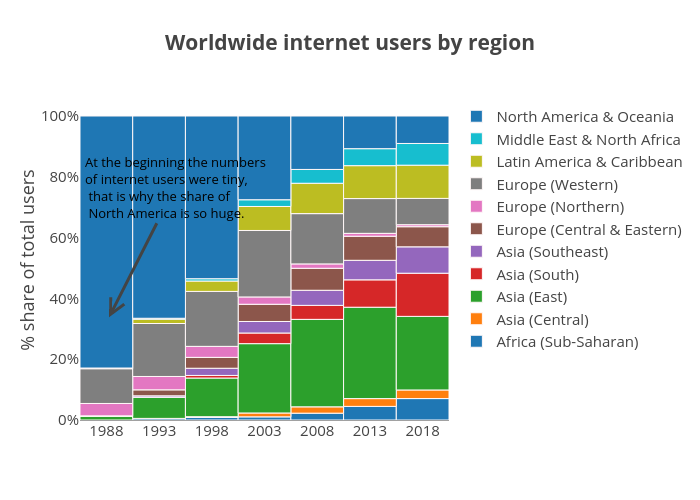
Martynasj's interactive graph and data of "Worldwide internet users by region" is a bar chart; with % share of total users in the y-axis. The x-axis shows values from -0.5 to 6.5. The y-axis shows values from 0 to 1.052631578947369. This visualization has the following annotation: At the beginning the numbersof internet users were tiny, that is why the share of North America is so huge.