Edit chart
Loading graph
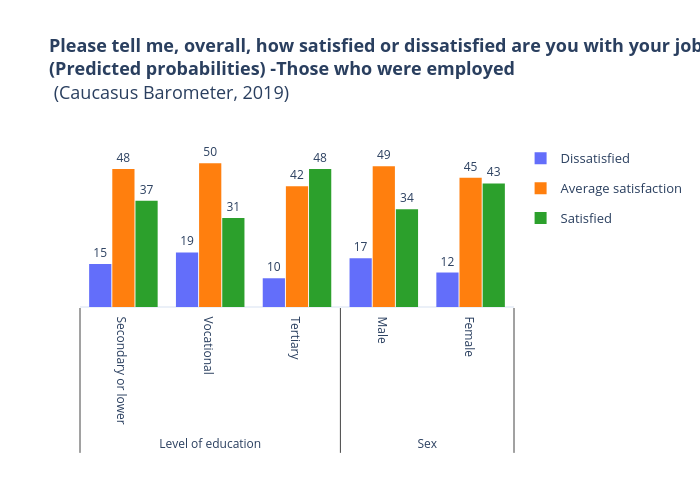
Makhareatchaidze's interactive graph and data of "Please tell me, overall, how satisfied or dissatisfied are you with your job?(Predicted probabilities) -Those who were employed (Caucasus Barometer, 2019)" is a bar chart, showing Dissatisfied, Average satisfaction, Satisfied; with in the x-axis and in the y-axis.. The x-axis shows values from -0.5 to 4.5. The y-axis shows values from 0 to 70.63157894736841.