Edit chart
Loading graph
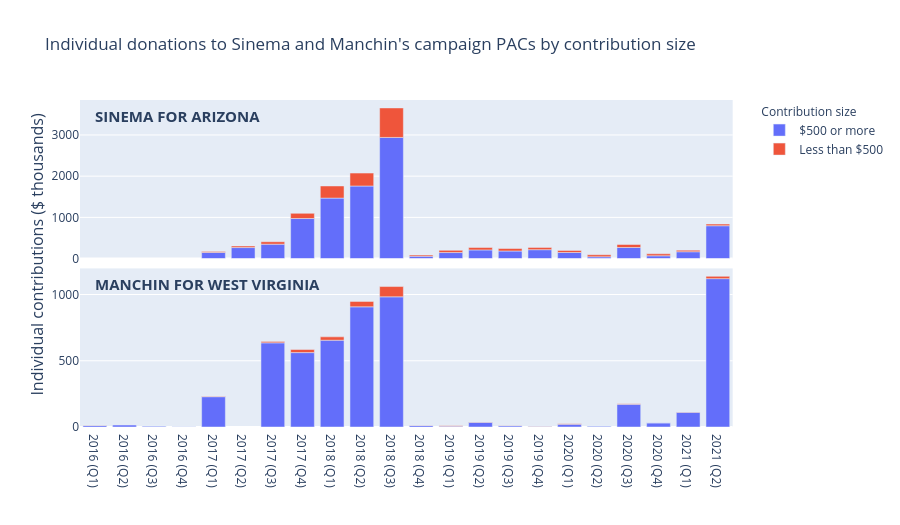
Mlalisse's interactive graph and data of "Individual donations to Sinema and Manchin's campaign PACs by contribution size" is a , showing $500 or more, $500 or more, Less than $500, Less than $500; with in the x-axis and {} in the y-axis.. The x-axis shows values from 0 to 0. The y-axis shows values from 0 to 0. This visualization has the following annotations: MANCHIN FOR WEST VIRGINIA; SINEMA FOR ARIZONA; Individual contributions ($ thousands)