Edit chart
Loading graph
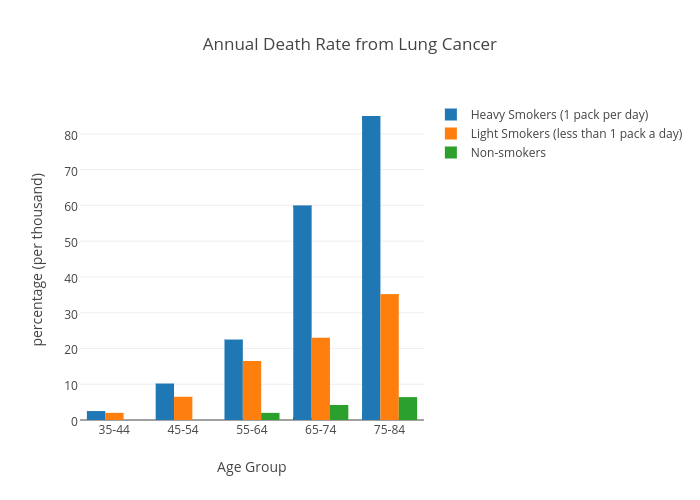
Lukeysa's interactive graph and data of "Annual Death Rate from Lung Cancer" is a bar chart, showing Heavy Smokers (1 pack per day), Light Smokers (less than 1 pack a day), Non-smokers; with Age Group in the x-axis and percentage (per thousand) in the y-axis.. The x-axis shows values from -0.5 to 4.5. The y-axis shows values from 0 to 89.47368421052632.