Edit chart
Loading graph
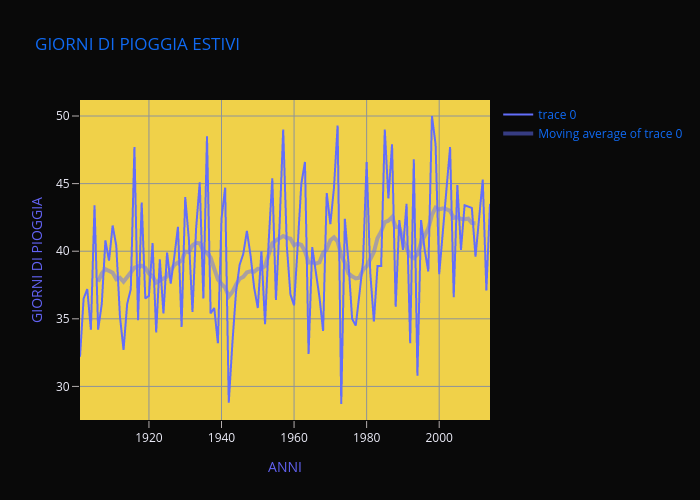
Lorenzom's interactive graph and data of "GIORNI DI PIOGGIA ESTIVI" is a line chart; with ANNI in the x-axis and GIORNI DI PIOGGIA in the y-axis.. The x-axis shows values from 1901 to 2014. The y-axis shows values from 27.516666666666666 to 51.18333333333333.