Edit chart
Loading graph
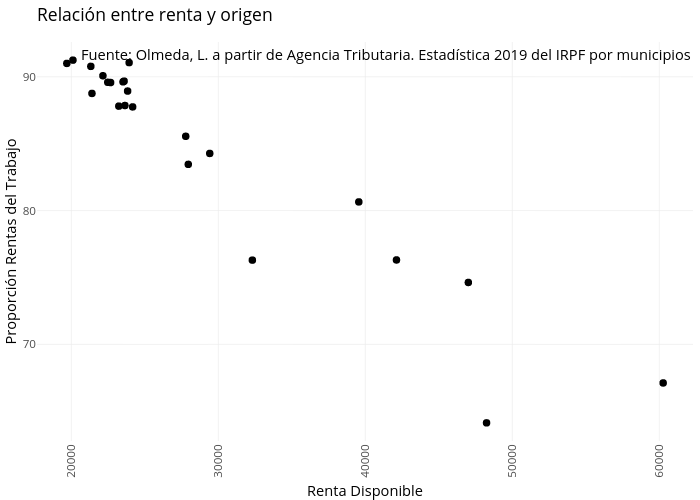
Leireolmeda's interactive graph and data of "Relación entre renta y origen" is a scatter chart; with Renta Disponible in the x-axis and Proporción Rentas del Trabajo in the y-axis.. The x-axis shows values from 17662.4 to 62291.6. The y-axis shows values from 62.7806 to 92.5994. This visualization has the following annotation: Fuente: Olmeda, L. a partir de Agencia Tributaria. Estadística 2019 del IRPF por municipios