Edit chart
Loading graph
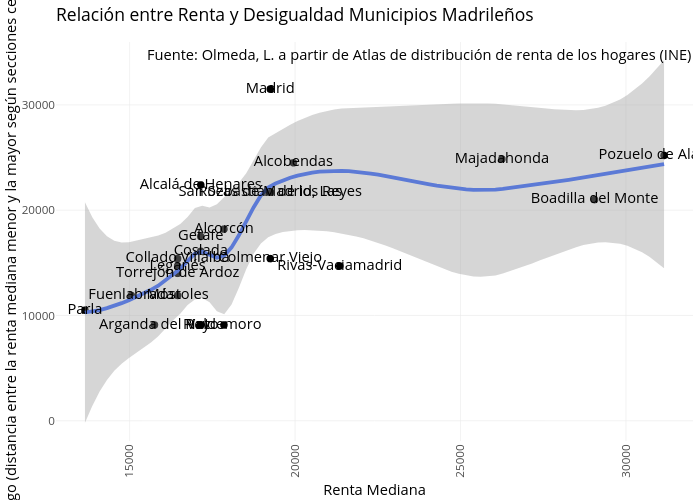
Leireolmeda's interactive graph and data of "Relación entre Renta y Desigualdad Municipios Madrileños" is a scatter chart, showing fitted values; with Renta Mediana in the x-axis and Rango (distancia entre la renta mediana menor y la mayor según secciones censales in the y-axis.. The x-axis shows values from 12775 to 32025. The y-axis shows values from -1920.53812752259 to 35973.6336651098. This visualization has the following annotation: Fuente: Olmeda, L. a partir de Atlas de distribución de renta de los hogares (INE)