Edit chart
Loading graph
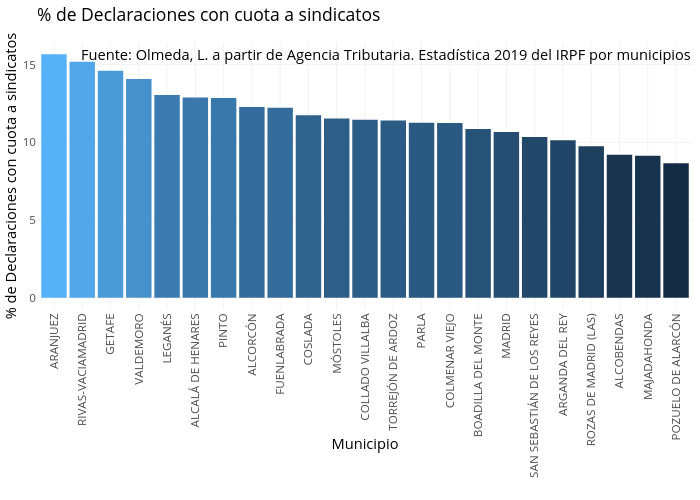
Leireolmeda's interactive graph and data of "% de Declaraciones con cuota a sindicatos" is a ; with Municipio in the x-axis and % de Declaraciones con cuota a sindicatos in the y-axis.. The x-axis shows values from 0.4 to 23.6. The y-axis shows values from -0.7835 to 16.4535. This visualization has the following annotation: Fuente: Olmeda, L. a partir de Agencia Tributaria. Estadística 2019 del IRPF por municipios