Edit chart
Loading graph
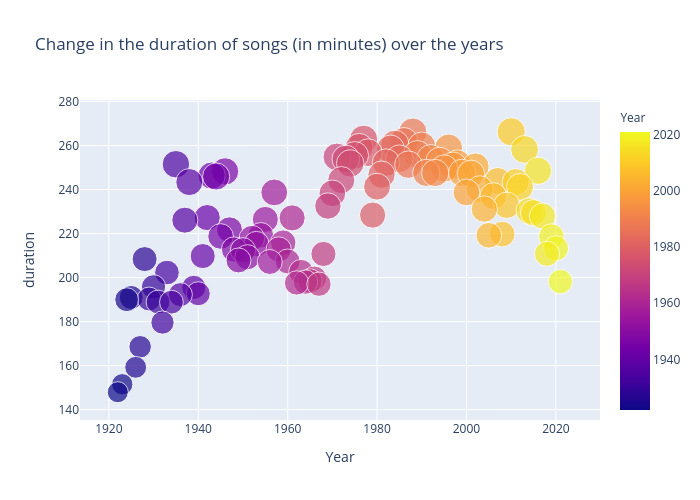
Lehak_narnauli's interactive graph and data of "Change in the duration of songs (in minutes) over the years" is a scatter chart; with Year in the x-axis and duration in the y-axis.. The x-axis shows values from 0 to 0. The y-axis shows values from 0 to 0.