Edit chart
Loading graph
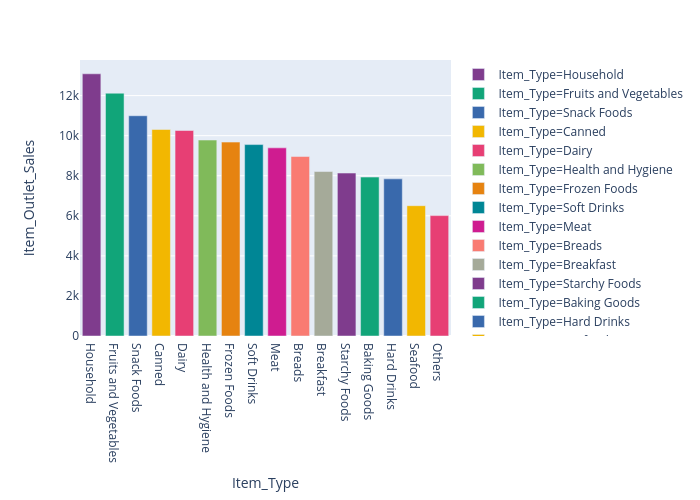
Lehak_narnauli's interactive graph and data of "Item_Outlet_Sales vs Item_Type" is a , showing Item_Type=Household, Item_Type=Fruits and Vegetables, Item_Type=Snack Foods, Item_Type=Canned, Item_Type=Dairy, Item_Type=Health and Hygiene, Item_Type=Frozen Foods, Item_Type=Soft Drinks, Item_Type=Meat, Item_Type=Breads, Item_Type=Breakfast, Item_Type=Starchy Foods, Item_Type=Baking Goods, Item_Type=Hard Drinks, Item_Type=Seafood, Item_Type=Others; with Item_Type in the x-axis and Item_Outlet_Sales in the y-axis.. The x-axis shows values from 0 to 0. The y-axis shows values from 0 to 0.