Edit chart
Loading graph
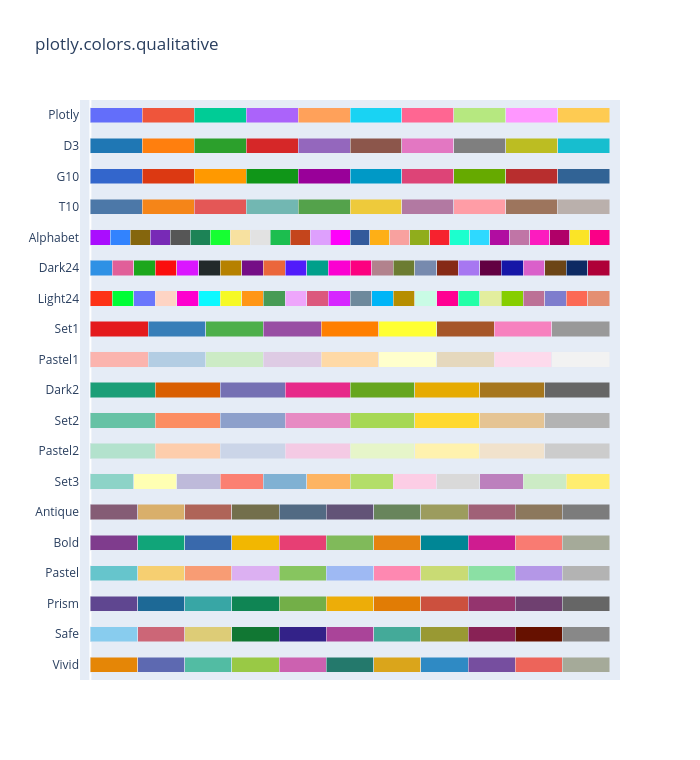
Lehak_narnauli's interactive graph and data of "plotly.colors.qualitative" is a stacked bar chart. The x-axis shows values from -0.02 to 1.02. The y-axis shows values from 0 to 0.