Edit chart
Loading graph
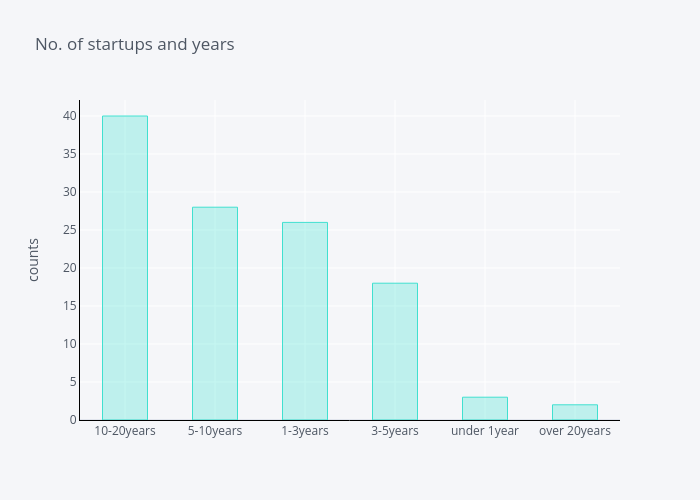
Lehak_narnauli's interactive graph and data of "No. of startups and years" is a bar chart, showing difference_level; with counts in the y-axis. The x-axis shows values from -0.5 to 5.5. The y-axis shows values from 0 to 42.10526315789474.