Edit chart
Loading graph
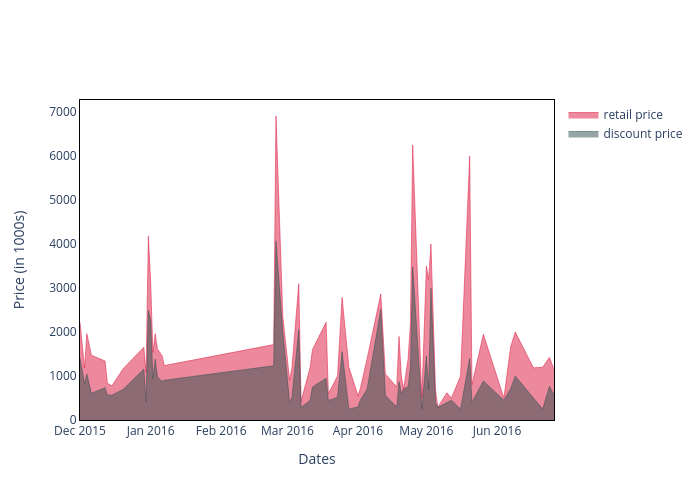
Lehak_narnauli's interactive graph and data of "Price (in 1000s) vs Dates" is a filled scatter chart, showing retail price vs discount price; with Dates in the x-axis and Price (in 1000s) in the y-axis.. The x-axis shows values from 0 to 0. The y-axis shows values from 0 to 0.