Edit chart
Loading graph
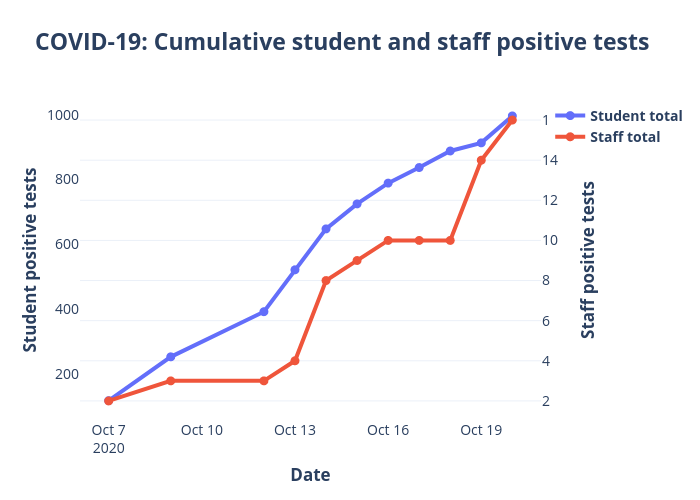
L_e_bell's interactive graph and data of "COVID-19: Cumulative student and staff positive tests" is a , showing Student total vs Staff total; with Date in the x-axis and Student positive tests in the y-axis.. The x-axis shows values from 2020-10-06 04:50:59.1195 to 2020-10-20 19:09:00.8805. The y-axis shows values from 59.45061728395061 to 1045.