Edit chart
Loading graph
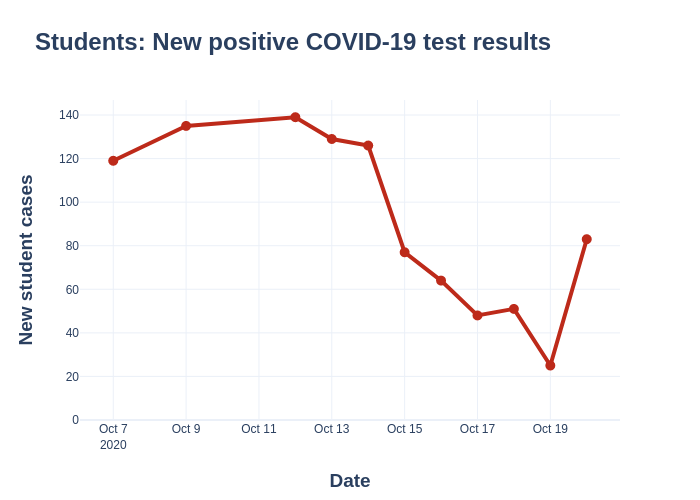
L_e_bell's interactive graph and data of "Students: New positive COVID-19 test results " is a ; with Date in the x-axis and New student cases in the y-axis.. The x-axis shows values from 2020-10-06 06:16:14.8573 to 2020-10-19 17:43:45.1427. The y-axis shows values from 0 to 146.9009900990099.