Edit chart
Loading graph
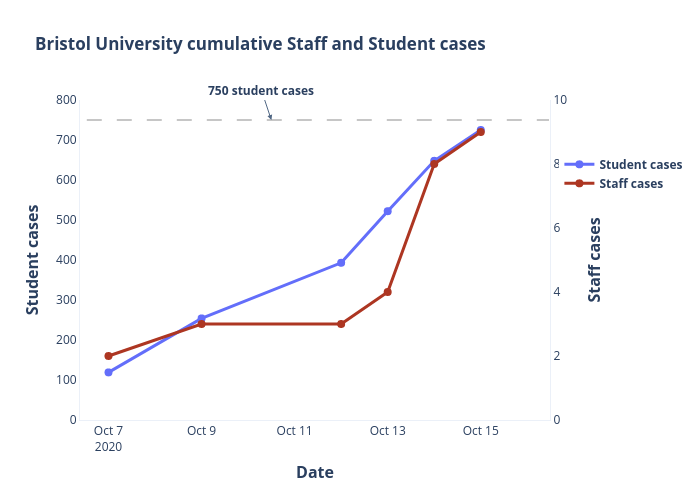
L_e_bell's interactive graph and data of "Bristol University cumulative Staff and Student cases" is a , showing Student cases vs Staff cases; with Date in the x-axis and Student cases in the y-axis.. The x-axis shows values from 2020-10-06 10:18:59.8412 to 2020-10-16 11:31:14.3131. The y-axis shows values from 0 to 800. This visualization has the following annotation: 750 student cases