Edit chart
Loading graph
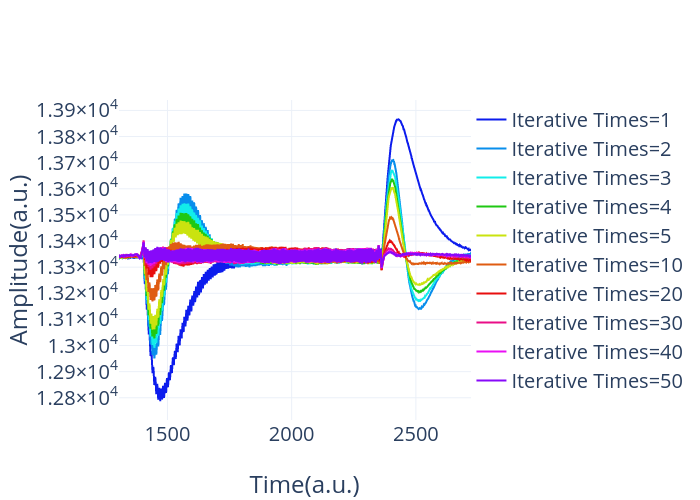
Li-song's interactive graph and data of "Amplitude(a.u.) vs Time(a.u.)" is a line chart, showing Iterative Times=1, Iterative Times=2, Iterative Times=3, Iterative Times=4, Iterative Times=5, Iterative Times=10, Iterative Times=20, Iterative Times=30, Iterative Times=40, Iterative Times=50; with Time(a.u.) in the x-axis and Amplitude(a.u.) in the y-axis.. The x-axis shows values from 1304.9527633393031 to 2798.35262347653. The y-axis shows values from 12714.967032997318 to 13939.909201981327.