Edit chart
Loading graph
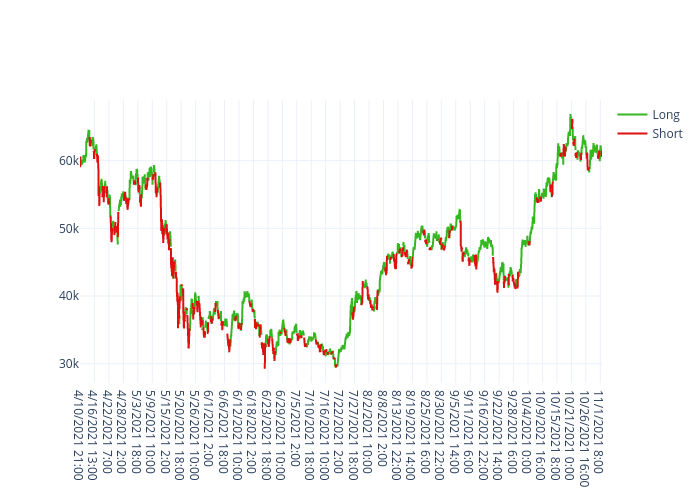
Ko4ka's interactive graph and data of "Long vs Short" is a line chart, showing Long vs Short. The x-axis shows values from 0 to 4912. The y-axis shows values from 27148.054444444446 to 68966.76555555555.