Edit chart
Loading graph
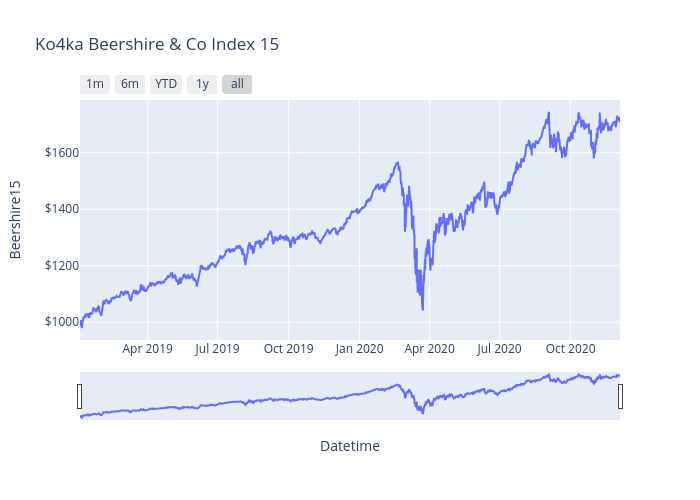
Ko4ka's interactive graph and data of "Ko4ka Beershire & Co Index 15" is a line chart; with Datetime in the x-axis and Beershire15 in the y-axis.. The x-axis shows values from 0 to 0. The y-axis shows values from 0 to 0.